The air we breathe is made up of mainly 2 gases - oxygen, and nitrogen.
There are also small amounts of other gases (for example, carbon dioxide, and methane) and tiny suspended particles like pollen and dust.
Air pollution is anything in the air that is harmful to people.
Some of these ‘other gases’ and particles can be harmful to our health and irritate our lungs.
The air pollutants that are considered to impact our health the most are nitrogen dioxide (NO2) and particulate matter (PM).
Nitrogen dioxide (or NO2 for short) is a poisonous gas and
can be produced naturally by lightning and some plants.
However, most of the nitrogen dioxide in our cities are produced from burning fuels like coal,
oil and gas but over 80% of it is thought to come from burning diesel and petrol in our cars.
Particulate matter (or PM for short) are the particles suspended in the air.
PM can be from natural sources such as pollen and dust but can also contain more harmful tiny particles.
These can be made from different materials like metals or plastics, for example, from car brakes and tyres.
These tiny particles are so small they can get trapped inside our lungs.
How does it affect us?
Children are more vulnerable to air pollution than adults as they breathe faster and their lungs are still growing.
Though, anyone exposed to high levels of air pollution, over a long time,
has a greater chance of developing illness like asthma, lung cancer, diabetes and heart disease.
Buggies and prams, that many small children use, are at a very similar height to car exhausts and so this puts small
developing lungs in a potentially dangerous place. Cars can also trap the air pollution inside them,
especially if the car is in a queue of traffic, where the exhaust from the car in front is being drawn inside.
(TOP TIP: You can close the air vents in your car to reduce the pollution getting in, but it would be better to walk or cycle, if you can)
How are we measuring it?
Air pollution can be measured in different ways, using different things,
For example,
Using a test tube stuck on a lamp post (and send to a laboratory for results).
These are very cheap and easy to use but you have to wait for 2 weeks or more to see the results.
You get 26 readings in a year using these.
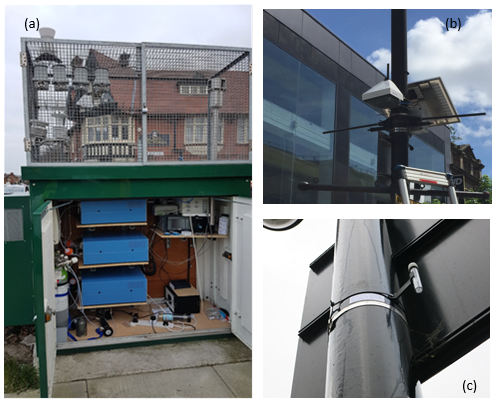
Using a big roadside cabinet with lots of expensive machines inside taking very precise measurements (see Picture 1a).
As they are so expensive, we can only take these precise measurements in a few places.
You can take a measurement every 5 minutes and you see the results immediately on a computer.
Using sensors (like AQmesh) that are much smaller so they can be fitted to a lamp post.
They are less expensive but the readings are less precise.
We call these ‘indicative’ sensors as they follow the same pattern as the big roadside cabinets but the numbers are not always exactly right.
AS they don’t cost as much as the roadside cabinets, we can take measurements in many more places.
The Urban Observatory, from Newcastle University, have over 200 ‘indicative’ air quality sensors. 66 of these are called AQmesh pods, which is the type of air quality sensor used in the healthy school project. We also have 4 big roadside cabinets with an 3 more being installed in Nov 2019. All the local authorities measure air pollution using roadside cabinets and lots of test tubes.
Picture 1: (a) showing inside a big roadside cabinet.
We use the cage on top to check that the sensors are showing similar readings.
(b) Showing an AQmesh, which is an indicative air quality sensor and (c) showing a diffusion (test) tube.
What do the numbers mean?
Some helpful hints about the units of measurement for air pollution.
Imagine a cardboard box that measures 1m by 1m by 1m – that’s a cubic metre!
Now imagine the same box with some particles inside.
The amount of the particles (in grams, g) is quite small so we have to use small units like micro-grams (µg).
Micro-grams (µg) are a million times smaller than a gram.
We often measure the amount of PM in two size groups, PM 10 and PM2.5.
As the particles are small, we have to use small units, which are even smaller than a millimetre (mm) - called micrometres (µm).
A micrometre is 1000 times smaller than a mm. Human hair is approximately 50-70 micrometres thick and a grain of sand is approximately 90 micrometres wide.
We look at how much of the PM in the box (cubic metre or 1m3) is smaller than 10 micrometres and 2.5 micrometres.
We call these PM 10 and PM2.5.
Legal limits and units of measurement.
In the UK, we want the amounts of air pollution to be as low as possible to protect our health. The government has come up with some limit values that we should try to keep below.
These are:
Below 40 µg/m3 over a whole year (called annual average) for PM10 and NO2.
Below 25 µg/m3 over a whole year for PM2.5
There are other rules to follow too- such as the maximum amount of pollutant that can be in the air in an hour or over a whole day. These are different for different air pollutants and the rules also say how many times they are allowed to be broken.
PM 10 should not be more than 50 µg/m3 in a day but it’s allowed to break this rule 35 times in a year. (So it’s allowed to be broken on 35 days a year)
NO2 should not be more than 200 µg/m3 in any hour but it’s allowed to break this rule 18 times in a year. (So that’s 18 hrs in a year. A year has 8760 hours in total (24 x 365).
The amount of air pollution varies with the weather and the season.
For example, pollution gets more concentrated during still, sunny or foggy weather,
as it can’t escape. When it’s wet and windy,
the air pollution gets carried away more quickly and the PM gets washed out of the air.
When it’s really sunny though, a lot of the NO2 reacts with the UV light and gets changed into Ozone,
so we often see lower NO2 levels in heatwaves.
Its important to think about the effects of the weather on air pollution and the data from the sensor.
If the amount of cars and vehicle exhausts are the same on two days,
could any differences you see in the data be explained by the weather and the wind direction?
Is the wind blowing the vehicle exhaust away from the sensor?
We have tried to position your sensor so that the usual wind direction pushes any air pollution to the sensor,
rather than away from it.
For Teachers: Additional resources and information